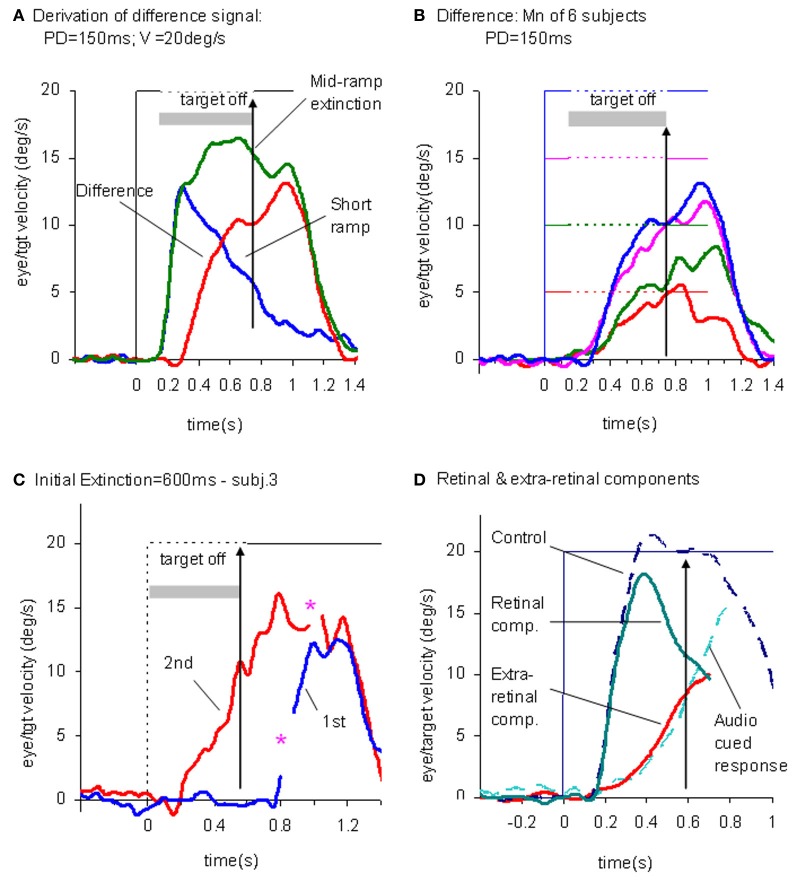
Figure 4.
Derivation of retinal and extra-retinal pursuit components. (A) Comparison of average eye velocity in the Mid-ramp Extinction (green trace), and Short Ramp (blue trace) conditions. The red trace represents the difference between these conditions. Target velocity = 20°/s; Initial target exposure duration (PD) = 150 ms. (B) The difference signal averaged across all six subjects for PD = 150 ms for each target velocity [5 (red), 10 (green), 15 (magenta), and 20°/s (blue)]. Gray shading indicates period of target extinction. (C). Example response from single subject during first (blue trace) and second presentations (red trace) of the Initial Extinction condition. Asterisks indicate occurrence of saccades. (D) Predicted behavior of retinal and extra-retinal components of pursuit during initial response to ramp target motion at 20°/s. Extra-retinal component (red trace) is derived from average Initial Extinction responses of six subjects, but terminates 80 ms after target onset. Cyan trace shows data obtained from similar Initial Occlusion experiment (Collins and Barnes, 2006, mean of 16 and 24°/s responses) in which response is aligned to audio cue occurring 700 ms before target appearance. Data in (A–C) derived from Barnes and Collins (2008a,b).

