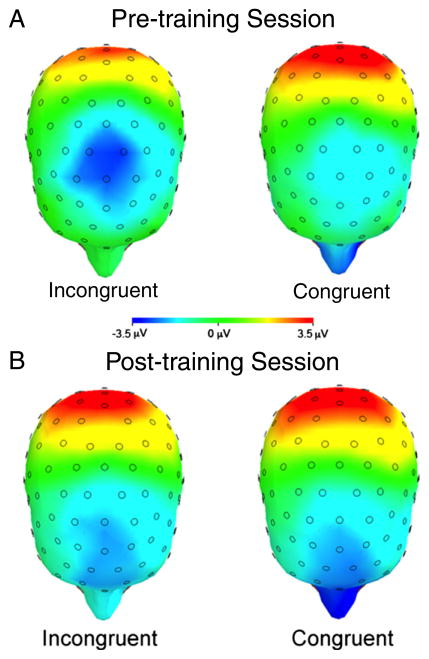
Fig. 4.
Topographic map of the N2 component for incongruent and congruent trials during the (A) pre-training session and (B) post-training session. Compared with the pre-training session, post-training session responses to incongruent trials were significantly reduced. Potential response to congruent trials shows no difference from pre- to post-training. Although the map has a more anterior distribution in the post- relative to the pre-training session, the Caudality (F, FC, C, Cp)×Session (pre-, post-training), Caudality×Session×Condition (incongruent, congruent) and Caudality×Laterality (left, central, right)×Session×Condition interactions were not significant (see also Table S4).

