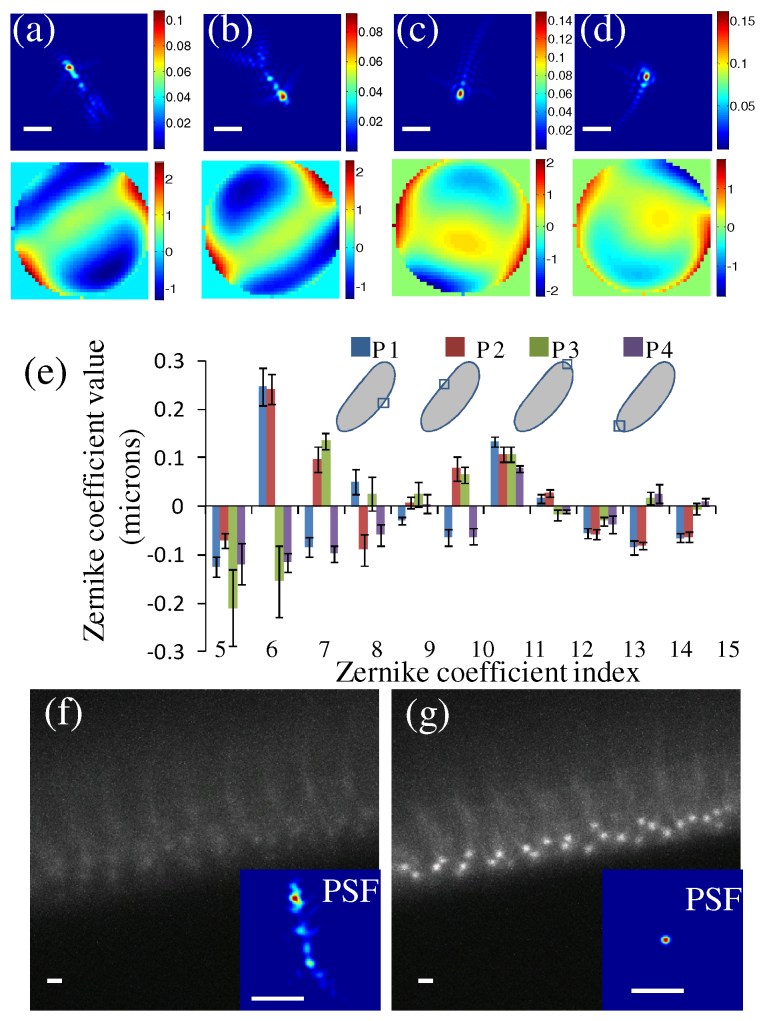
Fig. 4.
Wavefront measurement and correction. (a-d) The averaged point spread function (PSF) and wavefront errors over 6 measurements using EGFP-Cnn labeled centrosomes of a cycle 14 Drosophila embryo at four different locations (P1, P2, P3 and P4) at a depth of 60 µm. (e) The averaged coefficient value of the first 15 Zernike polynomial modes at these four locations. The error bar is the standard deviation for 6 measurements. (f-g) The images and PSF without and with correction for a cycle 14 Drosophila embryo with GFP-polo at a depth of 83 μm. Scale bars, 2 µm.

