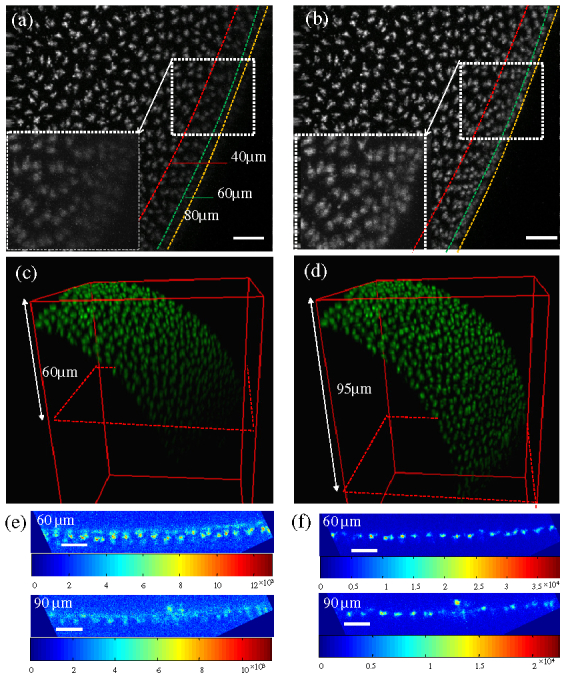
Fig. 5.

Comparison of the three-dimensional imaging without and with correction for imaging of cycle 13 fly embryos with EGFP-Cnn label. (a-b) The maximum intensity projection of the scan series from the top surface to 100 μm without and with AO ( Media 1 (3.3MB, MOV) ). (c-d) The 3D reconstructions without and with AO. (e-f) The confocal images without and with AO at the depths of 60 μm and 90 μm. The color maps are scaled to show the image data over its full range. Scale bar, 10 µm.
