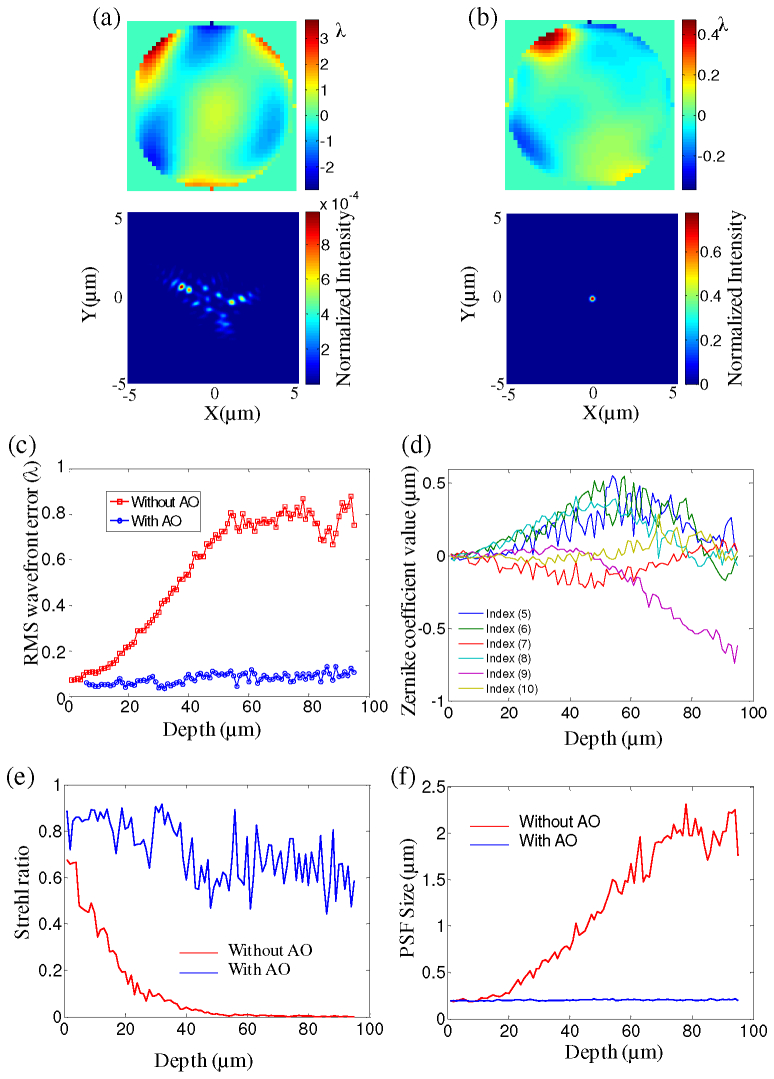
Fig. 6.
Comparison of the wavefront measurements and the PSFs without and with AO for different depths. (a-b) The wavefront measurements and PSF without and with AO at the depth of 90 μm ( Media 2 (3.8MB, MOV) ). (c) The RMS wavefront errors change with the depth. The red and blue lines indicate the measurement without and with AO respectively. (d) The Zernike coefficient values without AO with the change of depth. (e-f) The Strehl ratio and PSF size change for different depths. The red and blue lines indicate without and with AO respectively. (λ = 509 nm)

