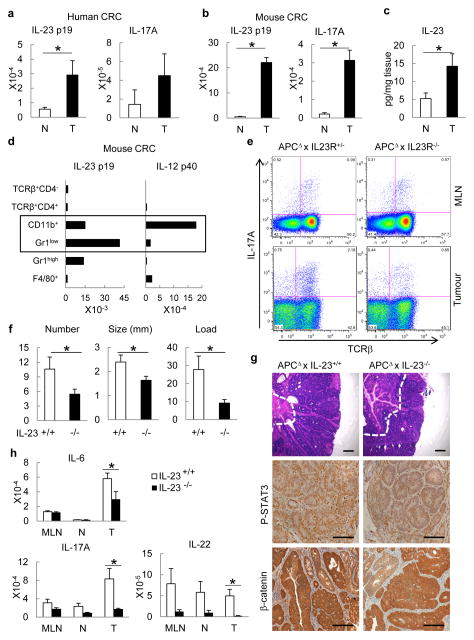
Figure 1. IL-23 controls CRC inflammation and tumorigenesis.
a, b, RT–qPCR for IL-23p19 and IL-17A mRNAs from colorectal tumours (T) and matching normal (N) colons of (a) human CRC patients (n = 7, P = 0.037 for IL-23p19) or (b) CPC-APC mice (n = 8, P = 5 × 10⁻⁵, 3.6 × 10⁻⁴, respectively). c, IL-23 protein was measured by ELISA in supernatants of cultured tumours and normal tissues of CPC-APC mice (n = 5, P = 0.04). d, RT–qPCR analysis of sorted haematopoietic myeloid cells (CD45+TCRβ− CD11b+) from tumours of CPC-APC mice (n = 4; pooled); populations: CD11b+ = Gr1−F4/80low; Gr1+ = Gr1+F4/80− Gr1high = Gr1highF4/80− F4/80+ = Gr1−/dimF4/80+ and T cells (CD45+TCRβ+). e, Intracellular cytokine staining of phorbol myristate acetate and ionomycin re-stimulated cells (Live/Dead−CD45+ gate). f, Five-month-old Il23−/− and control CPC-APC mice were sacrificed and tumour numbers, size and load were determined (n = 7, P = 0.04, 0.03, 0.01, respectively). g, Tumour sections were stained with haematoxylin and eosin or phospho-STAT3 and β-catenin antibodies. h, Cytokine mRNA analysis by RT–qPCR in mesenteric lymph nodes (MLN), normal (N) and tumour (T) tissue of 5-month-old Il23−/− and control CPC-APC mice (n = 6, P = 0.044, 0.007, 0.045, respectively). Data represent averages ± s.e.m. *P < 0.05. Scale bars, 100μm.

