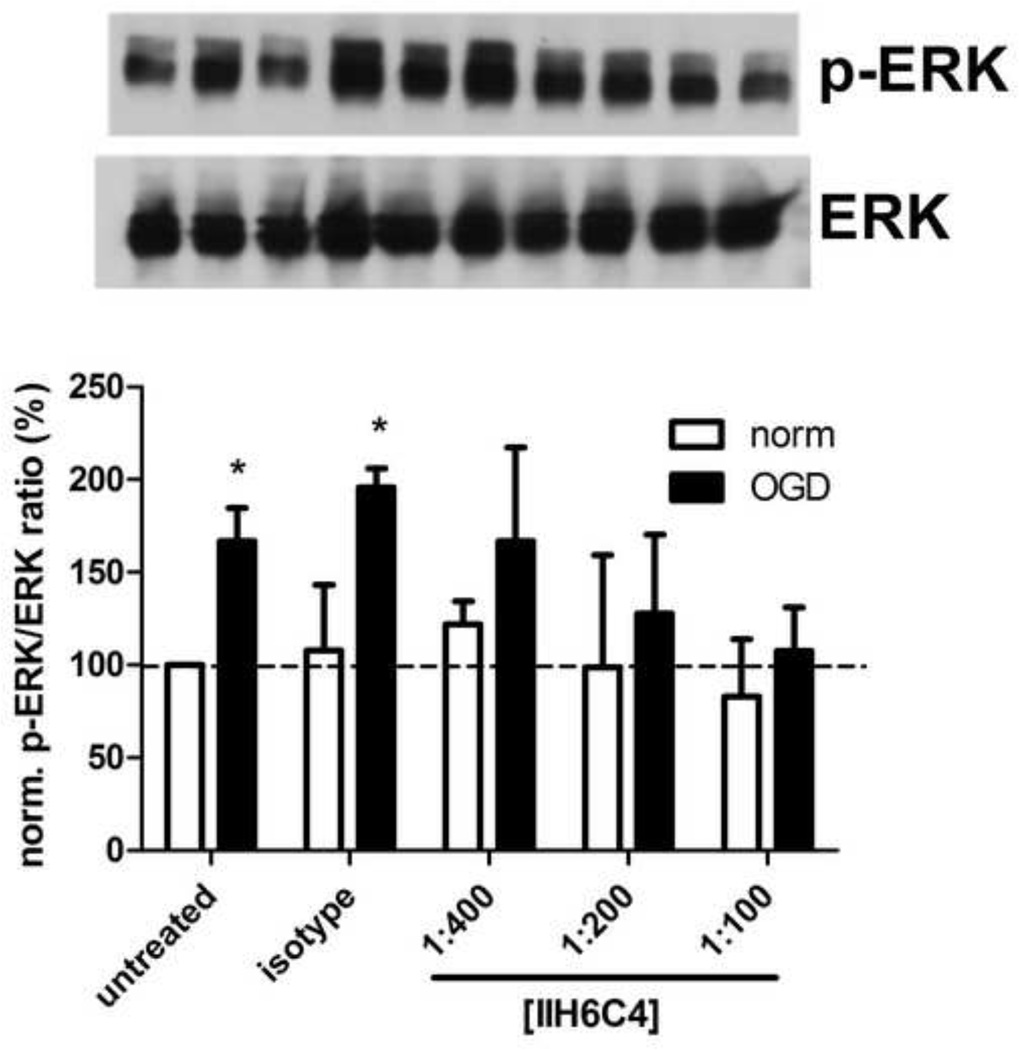
Figure 3. ERK activation in response to OGD is dystroglycan-dependent.
Astrocytes were pre-incubated with the concentration of IIH6C4 indicated (or isotype control antibody) 24 h prior to induction of OGD or normoxia. Protein was extracted from astrocytes immediately following OGD/normoxia for immunoblot. Blots shown are a representative experiment (bands correspond to the order indicated on the bar graph below); bar graphs represent the average of 3 independent experiments. Data are mean normalized band densities (measured between 40 and 50 kDa) ± S.D. Significance was determined by two-way ANOVA with a Bonferonni post-hoc test.* = p < 0.05 vs. normoxia.

