
Fig 5.
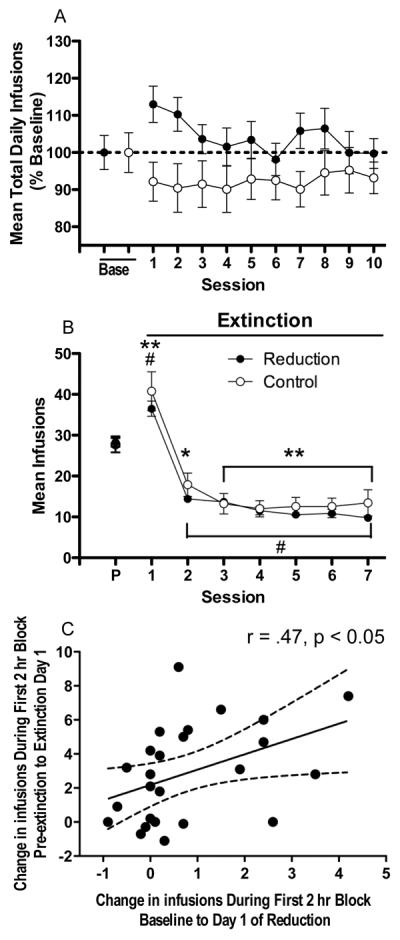
(A) Mean (±SEM) number of infusions earned per session during baseline and reacquisition of NSA (0.06 mg/kg/inf) in the reduction group and a comparable period in the control group, expressed as percent of baseline. Data from the intervening sessions are not shown. (B) Mean (±SEM) number of infusions per 23 hr session during pre-extinction (P) and extinction in the reduction and control groups. *,** Significantly different from pre-extinction (control group), p < 0.05, 0.01. # Significantly different from pre-extinction (reduction group), p <0.01. (C) Correlation between change in infusion rate (compared to pre-extinction) during the first 2 hr block on extinction day 1 (i.e., “within-session extinction burst”, see text) and change in infusion rate (compared to baseline) during the first 2 hr block on the first day of reduction.