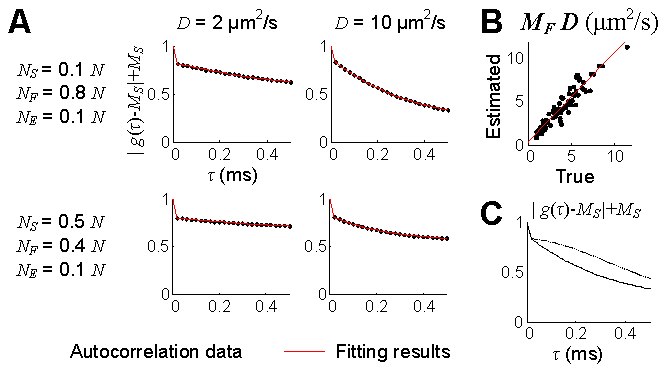
Fig. 7.

Numerical validation of the diffusion estimation. (A) Examples of decays of the autocorrelation functions obtained from the numerical position data and their fitting results. v = 0 mm/s and vz = 0 mm/s. (B) Results of the estimation of the diffusion coefficient. The estimation was tested for a total of 75 combinations (15 number densities and 5 diffusion coefficients). The estimation data was fit to a line (red), resulting in 1.04 × (true) + 0.30 (r2 = 0.89). The autocorrelation function was averaged across 1,000 random initial distributions of particles. (C) Decays of the autocorrelation functions between flowing and diffusing particles. The solid line shows decay of the MF-term of the autocorrelation function of diffusion particles (NS/N = 0.1, NF/N = 0.8, D = 10 μm2/s, v = 0, and vz = 0), while the dotted line shows that of flowing particles (NS/N = 0.1, NF/N = 0.8, D = 0, v = 5 mm/s, and vz = 0).
