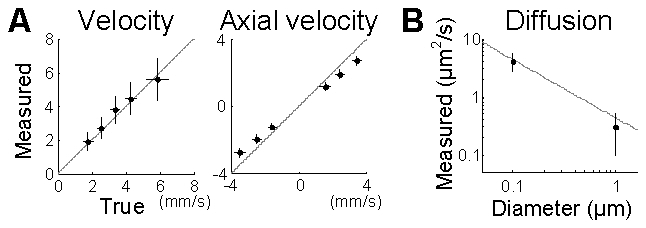
Fig. 8.

Experimental validation of DLS-OCT measurements of the flow velocity (A) and diffusion (B). Various combinations of the lateral scanning speeds and the axial piezo speeds implemented several equivalent flow angles, θ = arctan(vz/vt). The gray line in (B) shows the Einstein-Stokes equation. Data are presented in mean ± SD. The horizontal error bar in (A) resulted from the variation in the piezoelectric actuation.
