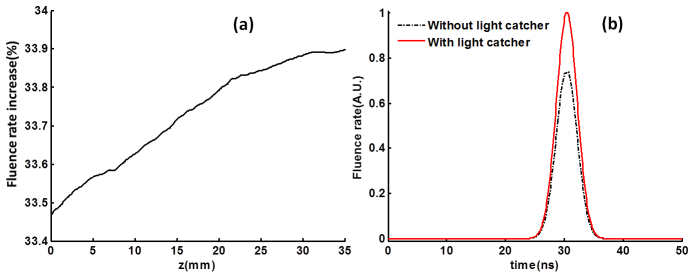
Fig. 4.

Increase of the peak fluence rate. (a) Inside the tissue along depth (z direction) at center (x = 0, y = 0), the peak fluence rate increase due to the light catcher in dB along z axis (x = 0, y = 0) is plotted. (b) The light pulse measured at the position (0, 0, 11) mm with/without light catcher. The peak fluence rate increase is about 33.6% at the top surface of the target (z = 11 mm).
