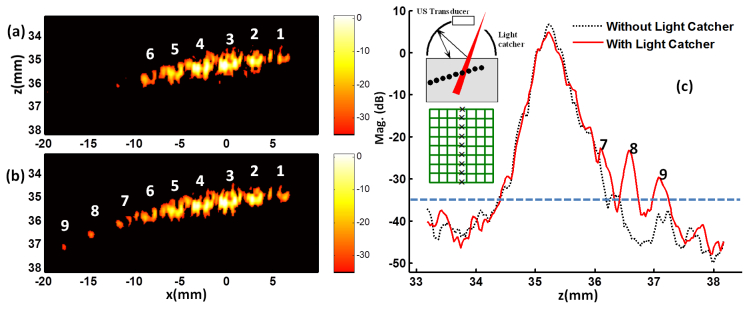
Fig. 8.

Enhancement of 2D PA image when the light catcher is used. The schematic illustration of the experiment using a linear array transducer is inserted in panel (c). A black mesh was embedded inside the phantom made of 9% gelatin and 1% milk, and the ultrasound transducer was aligned with the center line of the mesh. The side of each mesh normal to the ultrasound imaging plane were shown as a sequence of separate targets in PA image. (a) Only six mesh points were shown when light catcher was not used. (b) Three more points were detected when light catcher was applied. (c) The maximum intensity projection onto the depth (z axis) is plotted. The dashed line of −35dB in (c) corresponds to the black background in (a) and (b), representing the noise limit of the imaging system.
