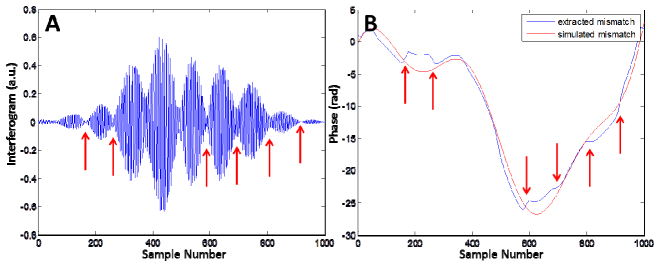
Fig. 3.

(A) A spectral interferogram with three scatterers. The wavenumbers where destructive interference occurs are indicated with red arrows. (B) A comparison of the extracted dispersion mismatch and the simulated dispersion mismatch. The red arrows indicate the same wavenumbers as in (A). Note that the abrupt changes in the extracted dispersion mismatch occur at the wavenumbers indicated with the arrows.
