
Fig. 4.
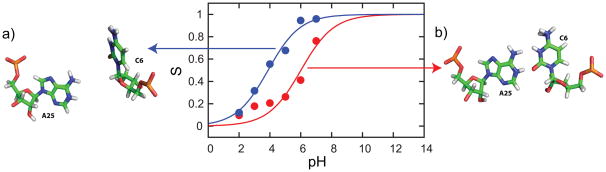
Titration curves from reprocessed trajectory that maintained a (red) closed conformation and (blue) semi-open conformation resulted in distinct pKa values of 6.0 and 3.9 respectively. (a) A sample snapshot of a semi-open conformation and (b) a typical closed conformation.