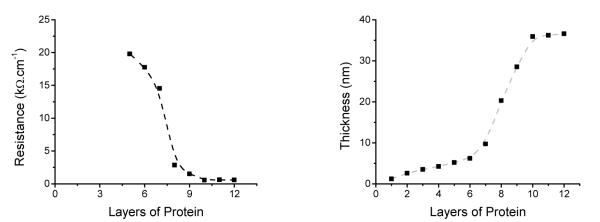
Figure 3.

A. Resistance of OTCE as function of the number of layers of protein adsorbed/pyrolyzed. Each data point represents the average ± standard deviation obtained for three electrodes, independently prepared. Line included to guide the eye.
B. Thickness of OTCE as function of the number of layers of protein adsorbed/pyrolyzed as measured by AFM. Each data point represents the average ± standard deviation obtained for three electrodes, independently prepared. Line included to guide the eye.
