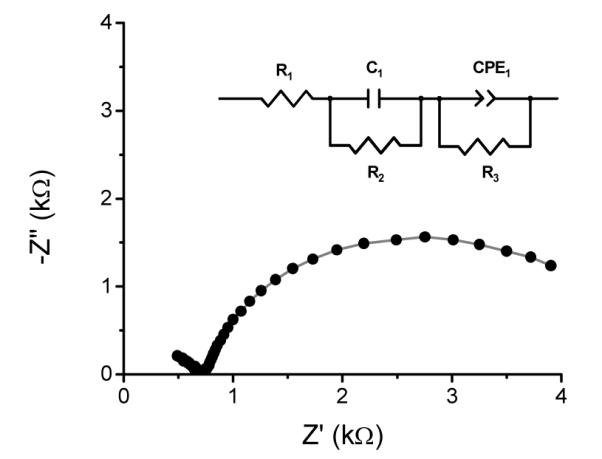
Figure 6.

Nyquist plot obtained with an OTCE fabricated with 12 layers of protein adsorbed/pyrolyzed (•). Conditions: 1.0 mM K3Fe(CN)6 in 0.1 M NaH2PO4/Na2HPO4 buffer + 0.1 M KCl, pH = 7.4. Also included in the figure is the spectrum ( ) simulated with the proposed equivalent circuit (insert).
