
Figure 1. The Welfare Impact of Reducing Malpractice Costs.
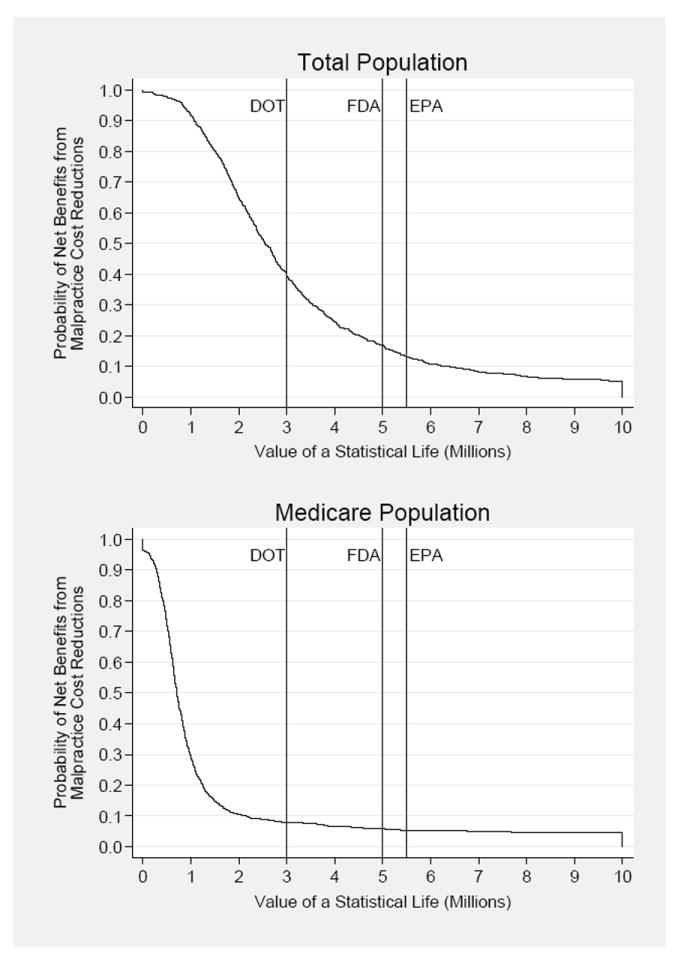
Notes: The curves depict the empirical probabilities that the estimated dollars saved per life lost exceed the given value of a statistical life. The empirical probabilities are based on 1000 bootstrap replications of the IV models in equations 2, which yield elasticities of malpractice cost on county-level mortality, and separately on medical costs. The results illustrated here use the three year moving average of malpractice costs lagged 3, 4 and 5 years. Vertical lines correspond to values of statistical life (in year 2000 dollars) used by the following federal government regulatory agencies: Department of Transportation (DOT), Food and Drug Administration (FDA), and Environmental Protection Agency (EPA).