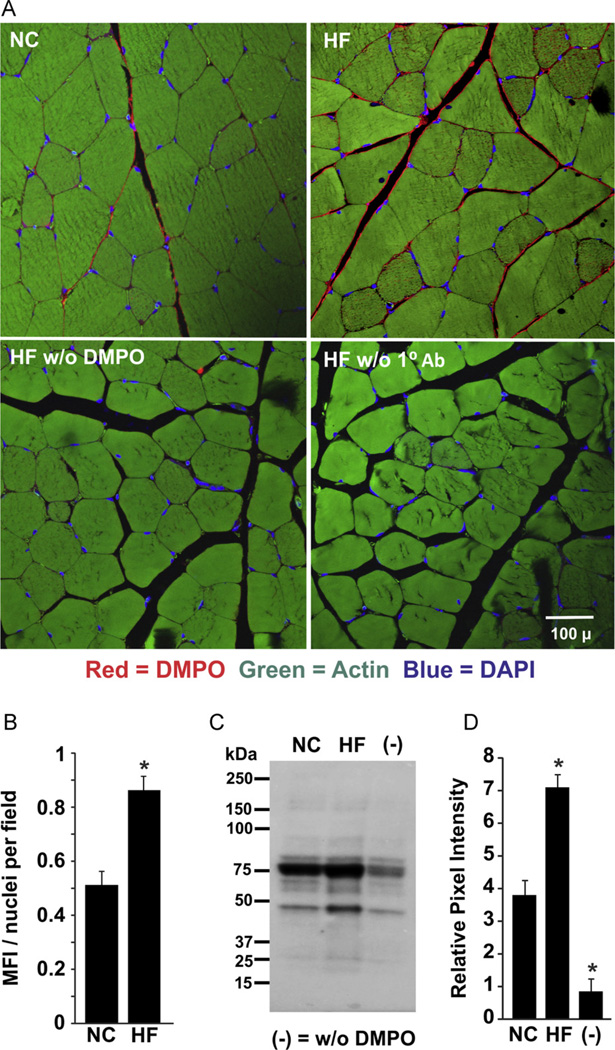
Fig. 2.
Obesity-induced free radical formation in skeletal muscle. (A) After 20 weeks of high-fat (HF) or normal chow (NC) diet, mice received DMPO (1.5 g/kg total ip) in three doses 24, 12, and 6 h before sacrifice or normal saline. At sacrifice, tissue was harvested, fixed, sectioned, and stained for DMPO–protein radicals using a rabbit polyclonal anti-DMPO primary Ab. (B) Mean fluorescence intensity (MFI) and nuclei/field were quantified using MetaMorph software as MFI/nucleus/field for all obesity images. Background from saline-treated mice was subtracted from both NC and HF images. (C) Representative Western blot of gastrocnemius tissues from HF and NC mice. (D) Densitometric analysis of independent blots using total staining for the entire lane. p < 0.05 vs NC (n=6). For (C) and (D), (−) indicates tissue from age-matched normal chow mice injected with 0.9% NaCl.

