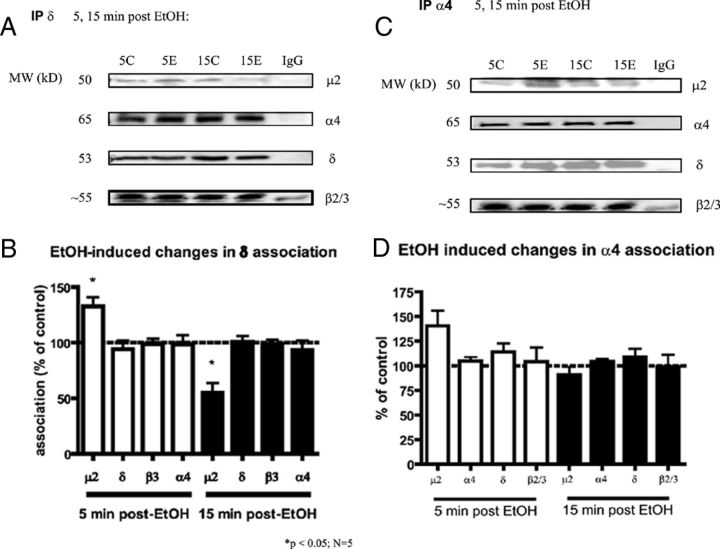
Figure 3.
GABAA-R δ and α4 subunit association with μ2 changes following EtOH exposures. A, B, EtOH caused a 32.7% increase in δ association with μ2 at 5 min, and a 55.1% decrease in δ association with μ2 15 min following EtOH treatment. The EtOH-induced changes in association of δ with μ2 are statistically significant from each other (**p < 0.0001), and statistically significant from control treated δ-μ2 associations (two-way ANOVA, Bonferroni post hoc test; *p < 0.05; N = 5). C, D, GABAA-R α4 subunit associations following EtOH exposure. EtOH caused a 38% increase in α4 association with μ2 at 5 min (not significant, p = 0.05, N = 4; but was significantly different from association of α4 and μ2 at 15 min, p < 0.001). This suggests that, at least at an early time point, these subunits are internalizing with δ-containing GABAA-R.

