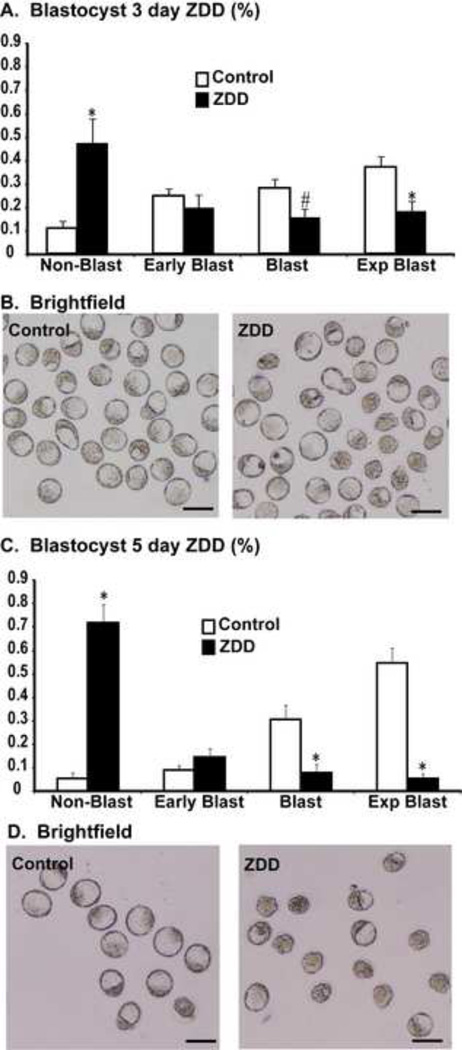
Figure 6. Effect of zinc deficiency on preimplantation development in vivo.
A. Proportion of embryos at different developmental stages including, non-blastocysts (single cell to morula), early blastocyst, blastocyst and expanded blastocyst collected from control and 3 day ZDD groups on 3.5 days after mating. B. Representative images of embryos from the 3 day treatment group. C. Proportion of embryos collected at different developmental stages collected from animals in the 5 day treatment group. C. Representative images of embryos from the 5 day treatment group (Control and ZDD). *Significant by student’s t-test, P<0.05, N=4–5 animals, group. Scale bar = 100 µm

