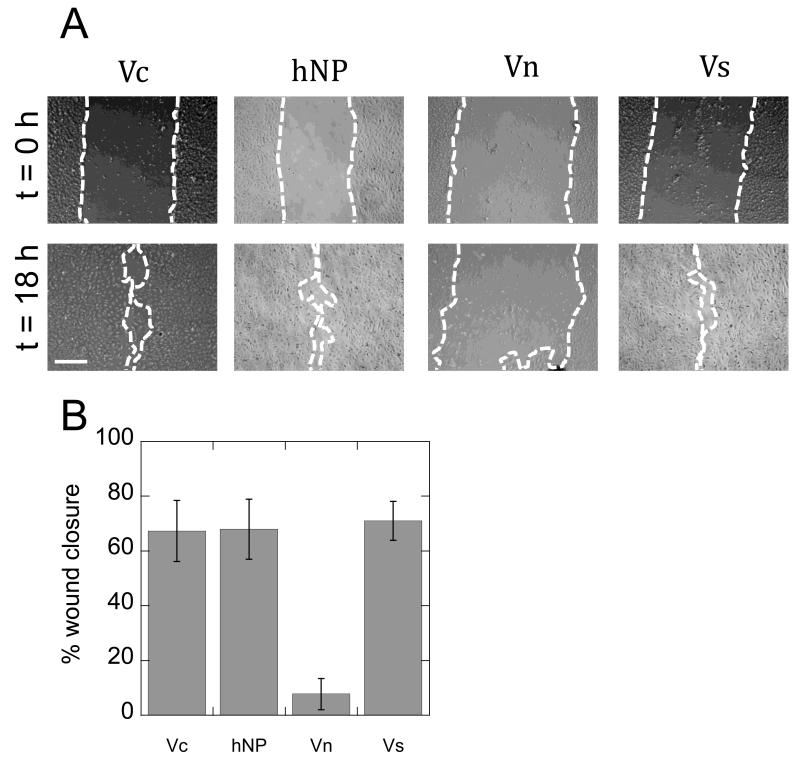
Figure 4.
Particle activity characterization. (A) Micrographs of cell migration experiment indicate movement of front from time 0 (top pictures) to 18 hours later (bottom pictures) in every condition except the negative control (Scale bar = 100 μm). (B) Quantification of the migration study shows particle bound VEGF is active. No statistical significance is observed between Vc, hNP, and Vs (n = 3).

