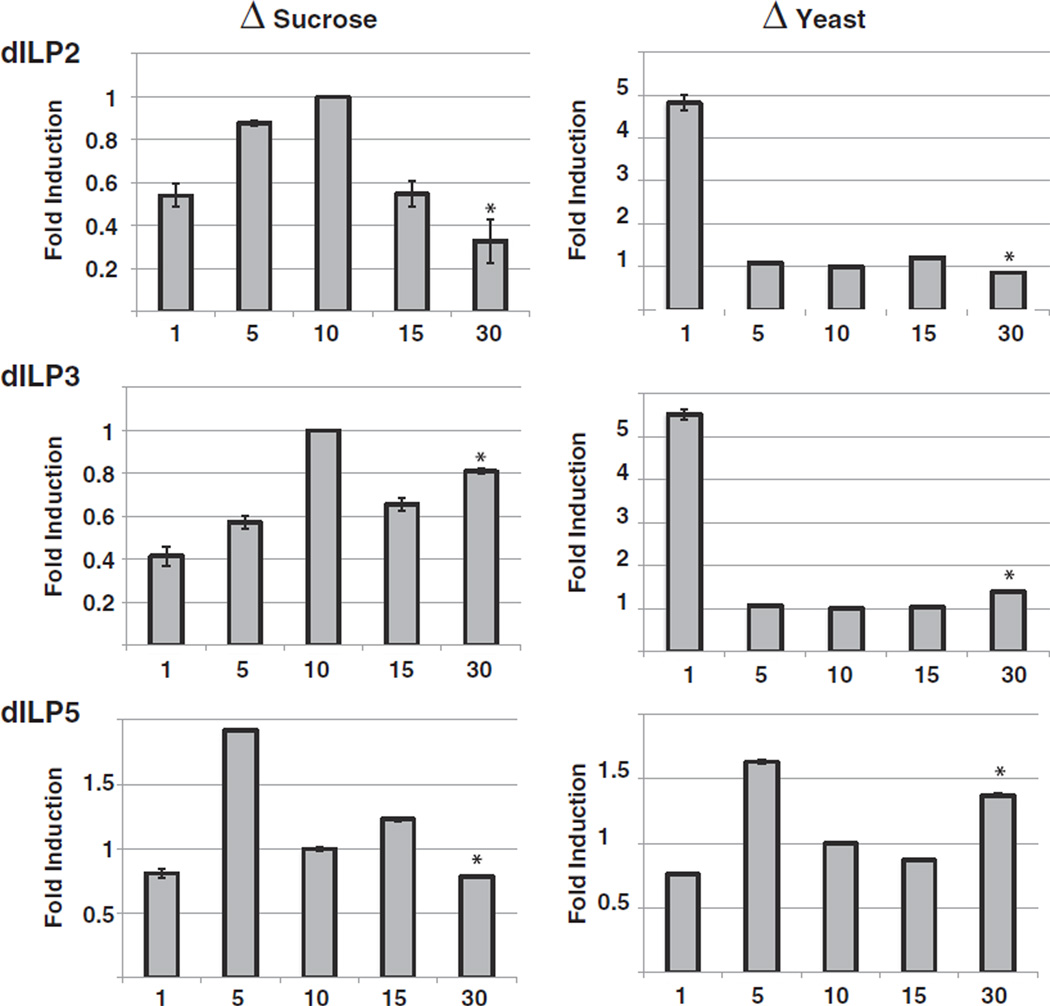
Fig. 5.
Effects of diet on dILP abundance. Flies were raised on ΔS diets (left panels) or ΔY diets (right panels) for ten days and their dILP levels determined by QPCR. Levels of dILP2, dILP3 and dILP5 were normalized against levels of the housekeeping gene rp49. Normalized dILP levels were compared to dILP levels of flies raised on 10% diets. Shown is a representative of two independent experiments (error bars represent the standard deviation of five biological replicates; asterisks denote p < 0.0001 for the comparisons of 30% foods to 10% control food).

