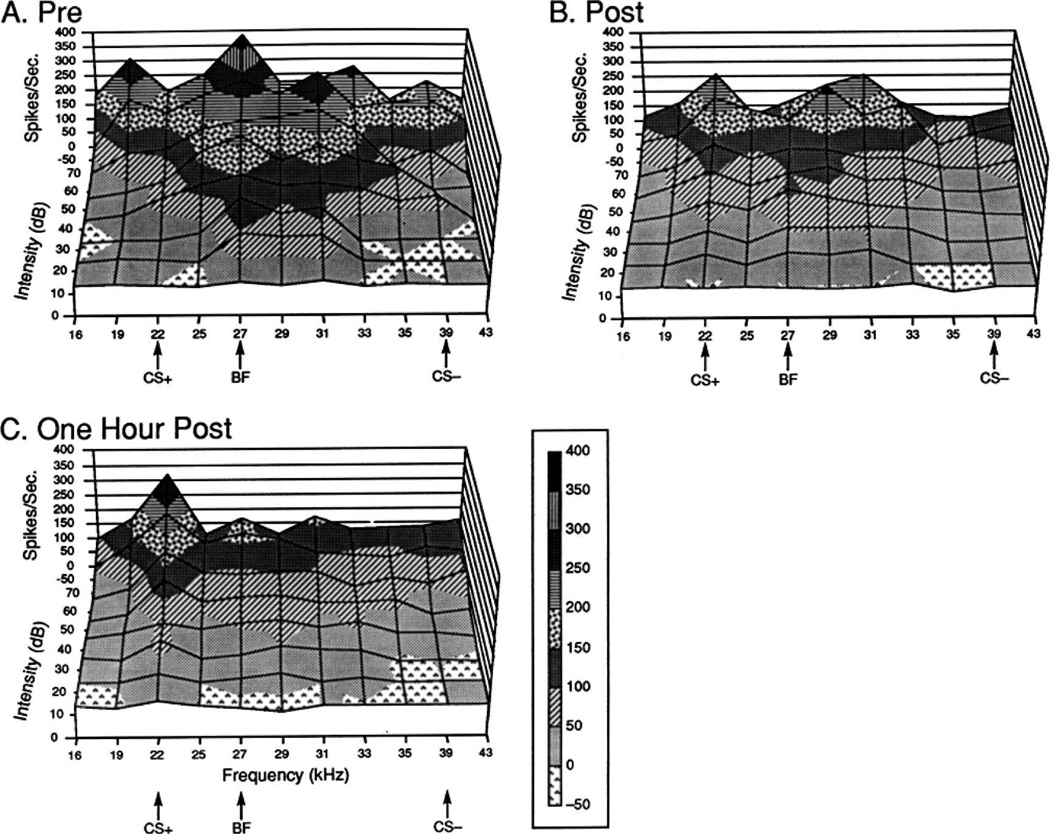
Figure 6.
Representation of neuronal responses in A1 (A) before, (B) immediately after, and (C) 1 h after two-tone discrimination training. The guinea pig received 30 each CS+ (22.0 kHz) and CS− (39 kHz) intermixed trials. Displayed are rates of discharge (y-axis) as a function of tonal frequency (x-axis) and level of testing stimuli (y-axis, 10–70 dB). Note that conditioning changed the “topography” of neuronal response. The pre-training best frequency of 27.0 kHz suffered a reduction in response as did the CS− frequency. In contrast, responses to the CS+ frequency increased. Strikingly, consolidation, in the form of a continued development of these changes is evident. After a period of 1 h of silence, the only excitatory response is at the CS+ frequency.

