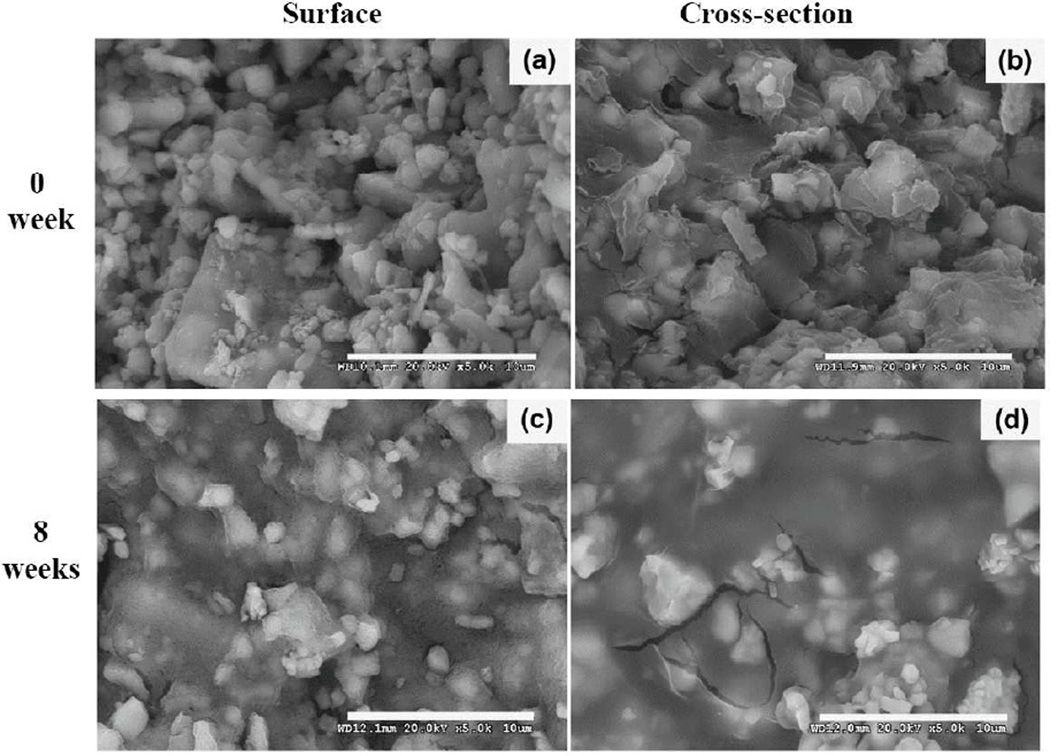
Figure 5.
Comparison of morphology revealed by SEM photomicrographs before and after degradation for eight weeks in the composition of HEMA/MA/Macromer = 0/80/20 with the macromer based on PEG600. Before degradation: (a) surface, and (b) cross-section; after degradation for eight weeks: (c) surface, and (d) cross-section. Scale bar = 10 µm

