Fig. 1.
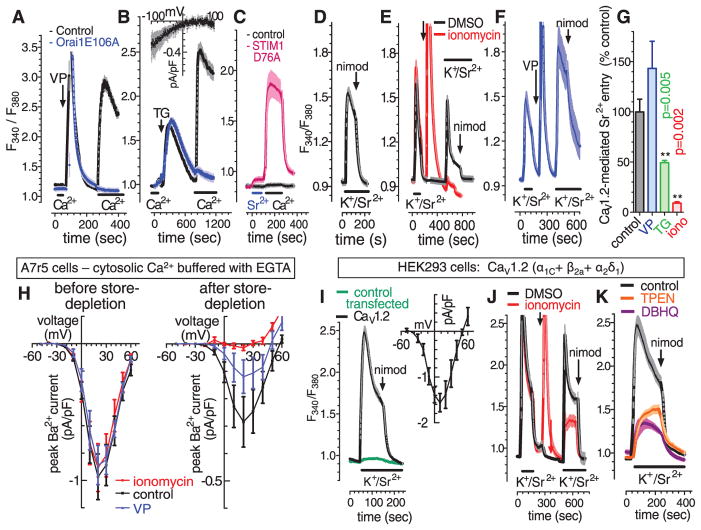
Store-dependent control of Orai and CaV1.2 channels. Fura-2 F340/F380 ratiometric responses to cytosolic Ca2+ in A7r5 VSMCs in response to 100 nM VP (A) or 2 μM TG (B), in control or Orai1-E106A-CFP–transfected cells in nominally Ca2+ free or 3 mM external Ca2+ (bars). (Inset) Current-voltage curve for CRAC channels in control A7r5 cells. (C) Fura-2 responses in control and STIM1-D76A–transfected A7r5 cells (bars, 3 mM external Sr2+ or Ca2+). (D) Fura-2 responses to application of external 134 mM K+ with 3 mM Sr2+ (bars, K+/Sr2+); 2 μM nimodipine (arrow). (E) Fura-2 responses to two sequential K+/Sr2+ pulses (bars) with addition of dimethyl sulfoxide (DMSO) or 2 μM ionomycin (arrow), and subsequent 2 μM nimodipine addition. (F) As in (E), except with the addition of 100 nM VP. (G) Statistics for results in (E), (F), and TG (trace not shown) (n = 6, paired t test). (H) I/V curve for whole-cell Ba2+ current through CaV1.2 channels in A7r5 cells with cytosolic Ca2+ clamped to 0.1 μM (10 mM EGTA; 3.4 mM CaCl2), either before (left) or 5 min after store depletion with 2 μM ionomycin, 100 nM VP, or control (right). (I to K) Fura-2 responses to K+/Sr2+ (bars) in HEK293 cells expressing three CaV1.2 subunits (α1C+ β2a+ α2δ1) or control-transfected cells. (I) K+/Sr2+ responses in CaV1.2-transfected and control-transfected cells; 2 μM nimodipine (arrow); inset, I/V curve for CaV1.2-transfected cells (n = 4). (J) Fura-2 responses to sequential K+/Sr2+ pulses (bars) with additions of DMSO or 2 μM ionomycin (arrow), and 2 μM nimodipine (arrows). (K) K+/Sr2 responses after DBHQ (10 μM, 10 min, present throughout) or TPEN (250 μM, 5 min, removed at K+/Sr2+ addition).

