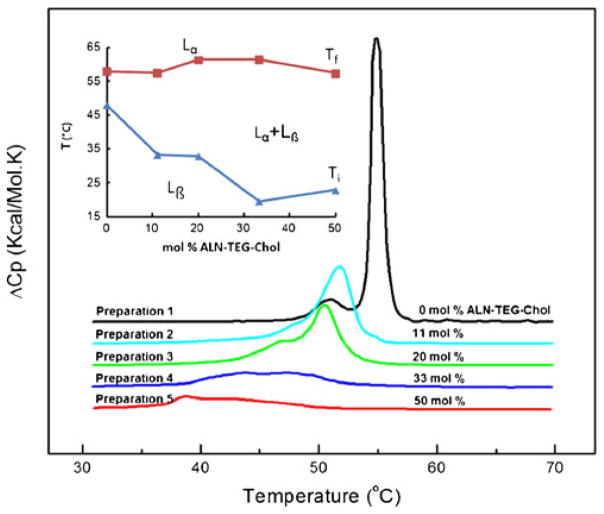
Fig. 3.
DSC thermograms of BBL formulated with DSPC and ALN-TEG-Chol (5 mg/mL). Inset: phase diagram representing the initial (Ti) and final (Tf) temperature of phase transition. With increasing ALN-TEG-Chol concentration, there is a greater range where both phases coexist: gel phase (Lβ) and liquid-crystalline phase (Lα).

