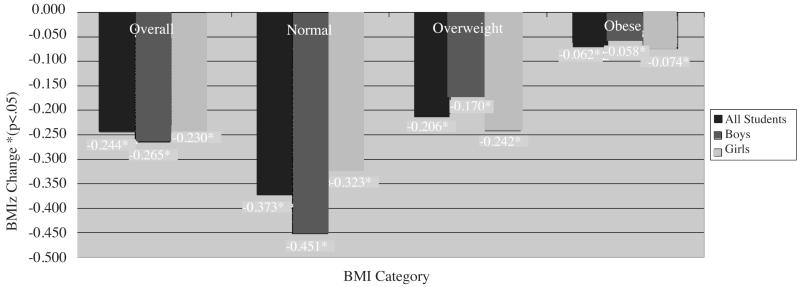
Figure 2. Change in Children’s BMI z Score by Baseline Weight Strata and Gender.
Change in BMI z-score units from baseline to post-intervention as calculated by paired t test, for all participants (bars shown at left), and stratified by weight category and by gender. A decrease in BMI z score for overweight or obese participants indicates movement in the direction of normal weight category. Children within the normal weight category also decreased their BMI z score; this did not reflect weight loss, because they continued growing in height during a period of less rapid weight gain.

