Figure 4.

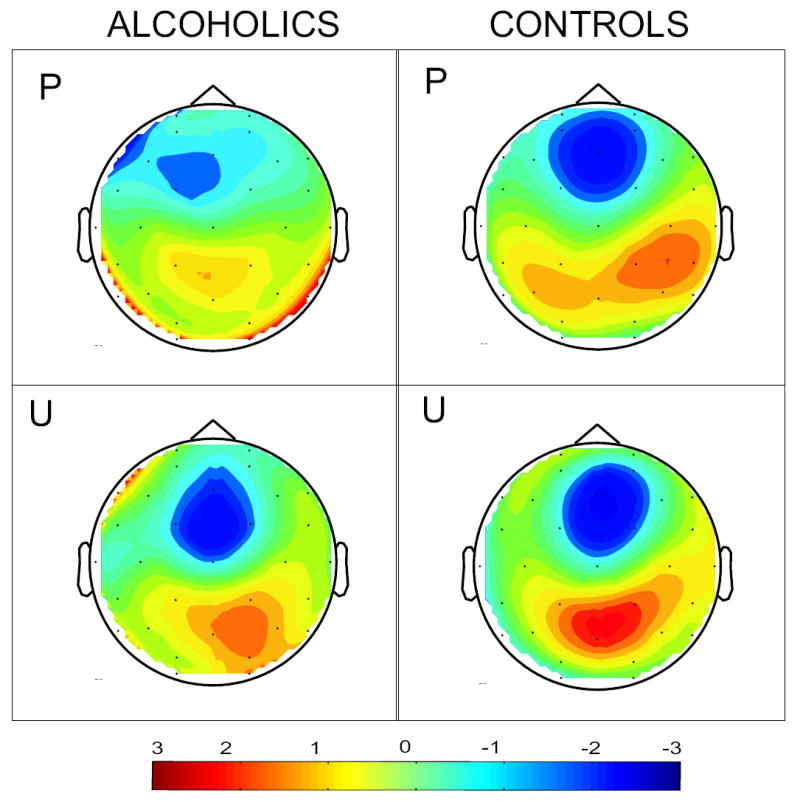
CSD (current source density) map in alcoholics and controls describing the source (red) and sink (blue) for primed (P) and unprimed (U) conditions from a fixed latency slice at 325 ms near the peak N400 response.

CSD (current source density) map in alcoholics and controls describing the source (red) and sink (blue) for primed (P) and unprimed (U) conditions from a fixed latency slice at 325 ms near the peak N400 response.