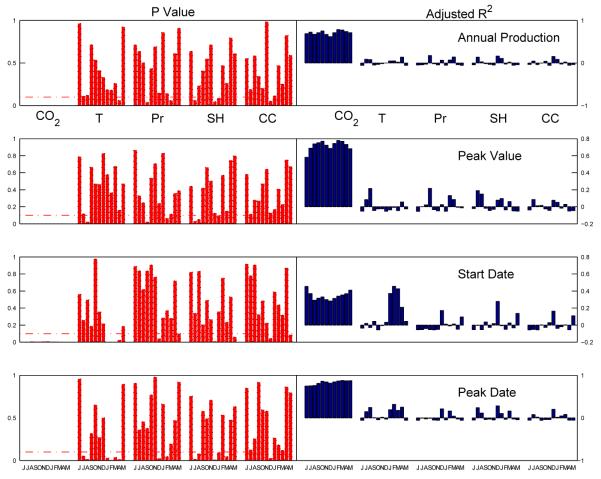
Figure 2.
P values and adjusted R2 for the relationships between pollen indices and monthly CO2 level, mean temperature(T), precipitation(Pr), sunshine hours(SH) and cloud coverage(CC) in June to December of previous year and January to May of current year; dashed line corresponds to P value equal to 0.1.

