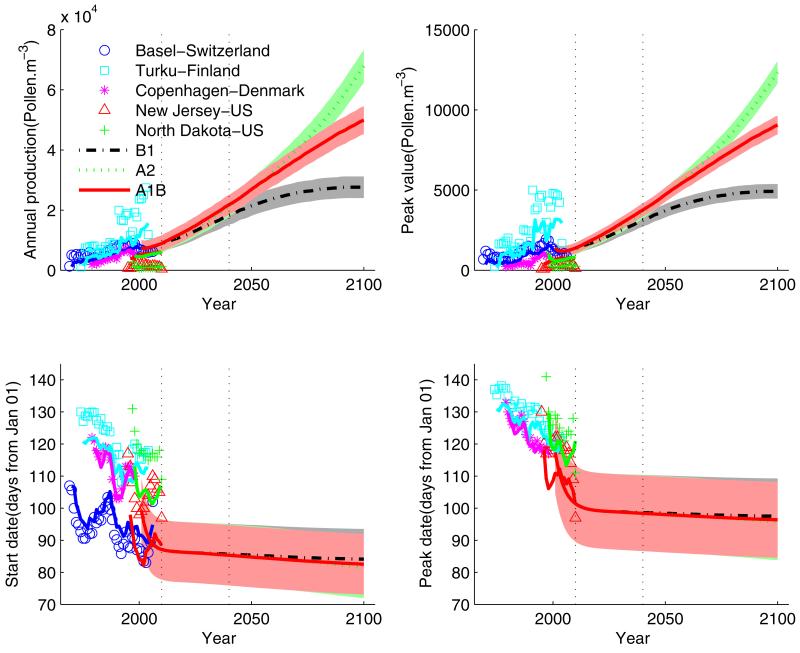
Figure 4.
Predictions of mean trends of pollen indices based on the global annual mean temperatures and global annual mean CO2 concentrations projected by the IPCC under three representative scenarios. Heavy lines are the mean trends and the corresponding shaded areas are top 5% HPD regions. Also shown on the left are time series of historical pollen indices and their corresponding mean trends calculated by the model.

