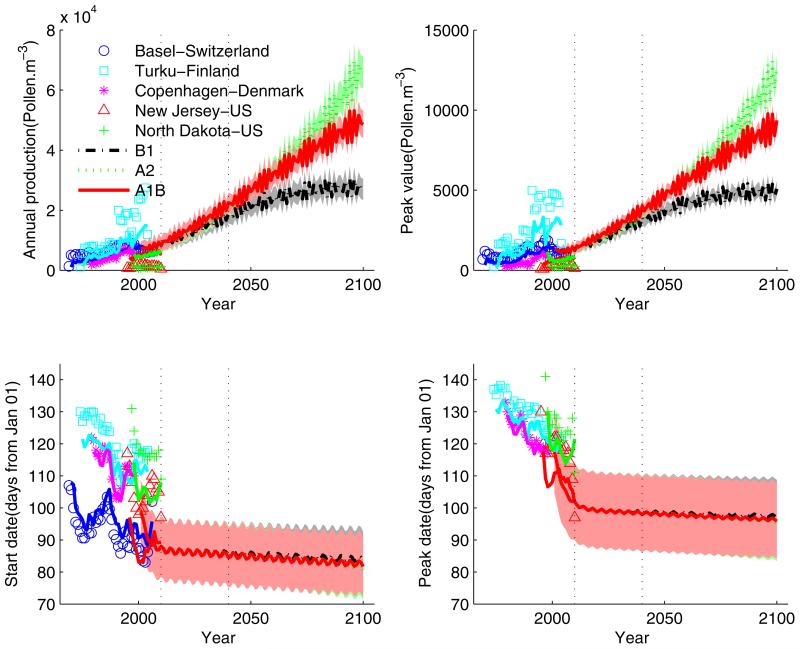
Figure 5.
Predictions of pollen indices based on the global annual mean temperature and global annual mean CO2 concentrations projected by the IPCC under three representative scenarios. The intrinsic inter-annual variation was used to simulate the fluctuations of pollen indices around the mean trends. Heavy lines are the predicted pollen indices and the corresponding shaded areas are top 5% HPD regions. Also shown on the left are time series of historical pollen indices and their corresponding estimates.

