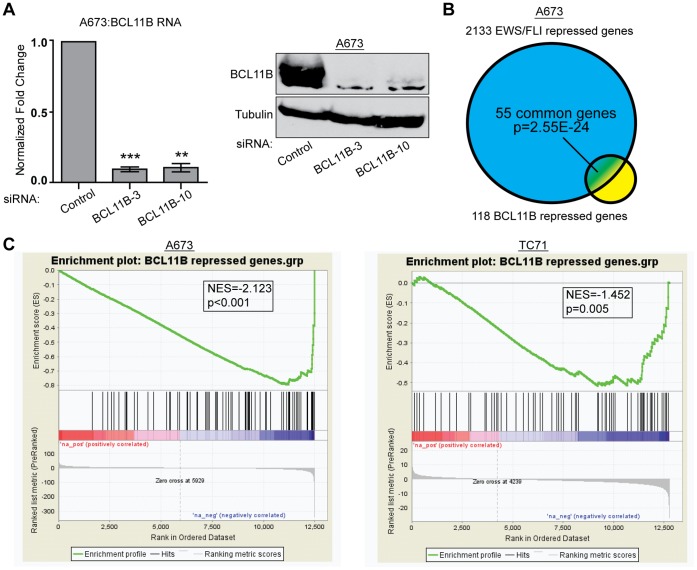
Figure 3. BCL11B represses genes that are part of the EWS/FLI repressed signature.
A. qRT-PCR (left) and western blot analysis (right) of A673 cells 48 hours post-transfection with a control siRNA (siControl) or siRNAs targeting BCL11B (siBCL11B-3 and siBCL11B-10). Error bars represent SD of three technical replicates. P-values were determined using a Student’s T-test comparing all conditions to control (** for p≤0.01, *** for p≤0.001). B. Venn diagram analysis shows significant overlap of the 118 gene BCL11B repressed gene set and the 2133 gene EWS/FLI repressed gene set. P-value determined by Chi square analysis. C. GSEA analysis comparing a rank-ordered EWS/FLI gene set (up-regulated genes to the left, down-regulated genes to the right) in A673 and TC71 cells to the BCL11B repressed gene set. NES indicates normalized enrichment scores. P-value determined by permutation testing.

