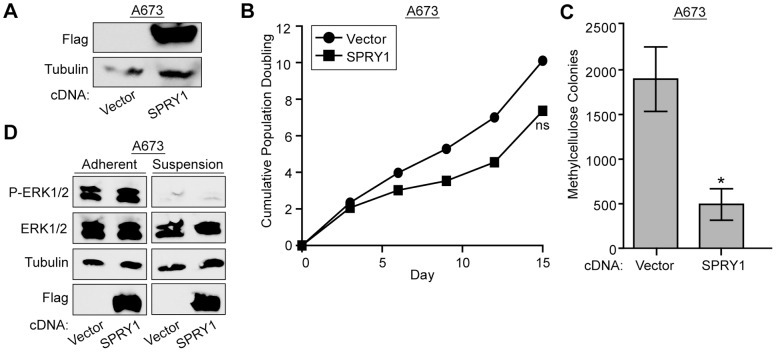
Figure 6. Re-expression of SPRY1 limits the transformation potential of Ewing sarcoma cells.
A. Western blot shows expression of 3xFLAG SPRY1 construct in A673 cells. B. Growth rates of A673 cells expressing 3xFLAG SPRY1 were determined using a 3T5 assay. P-values were determined using a Student’s T-test (ns for not significant).C. Anchorage independent growth of A673 cells expressing 3xFLAG SPRY1 was assessed by the ability to grow in methylcellulose. Error bars represent SD of two technical repeats. P-values were determined using a Student’s T-test (* for p≤0.05). D. Western blot shows levels of phosphorylated and total ERK1/2 when A673 cells are grown under adherent or suspension conditions in the presence or absence of 3xFLAG SPRY1 cDNA. Tubulin is used as a loading control and flag shows 3xFLAG SPRY1 expression.

