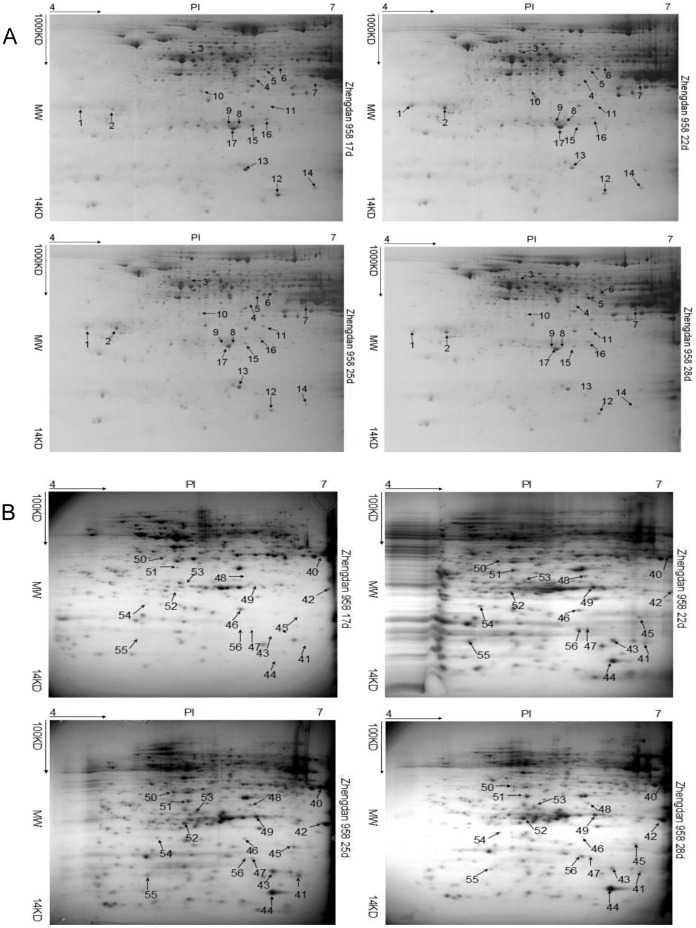
Figure 2. Representative 2-D maps.
Maps from left to right represent expressed proteins at 17, 22, 25, and 28 days after pollination in the endosperm (A) and embryo (B) of Zhengdan 958, respectively. Differentially expressed protein spots at any two stages with more than 2-fold changes in expression are indicated by arrows with numeral.

