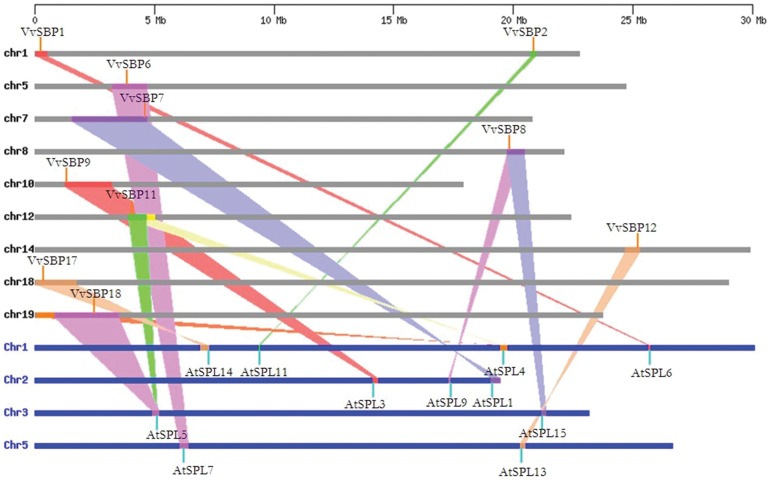
Figure 5. Synteny analysis of SBP-box genes of grape and Arabidopsis.
V. vinifera and Arabidopsis chromosomes are depicted as horizontal gray and blue bars, respectively. Grape and Arabidopsis SBP-box genes are indicated by vertical orange and blue lines, respectively. Colored bars denote syntenic regions between grape and Arabidopsis chromosomes; a twisted colored bar indicates that the syntenic regions are in opposite orientations.

