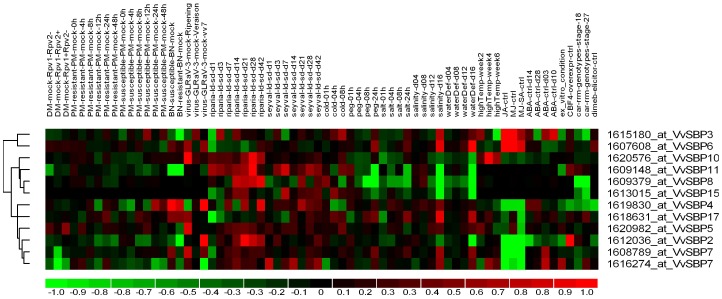
Figure 7. Hierarchical clustering of grape SBP-box genes.
Details of the experimental conditions utilized are provided in Table S6. Log2-based fold changes were used to create the heat map. Differences in gene expression are shown in color according to the scale.

