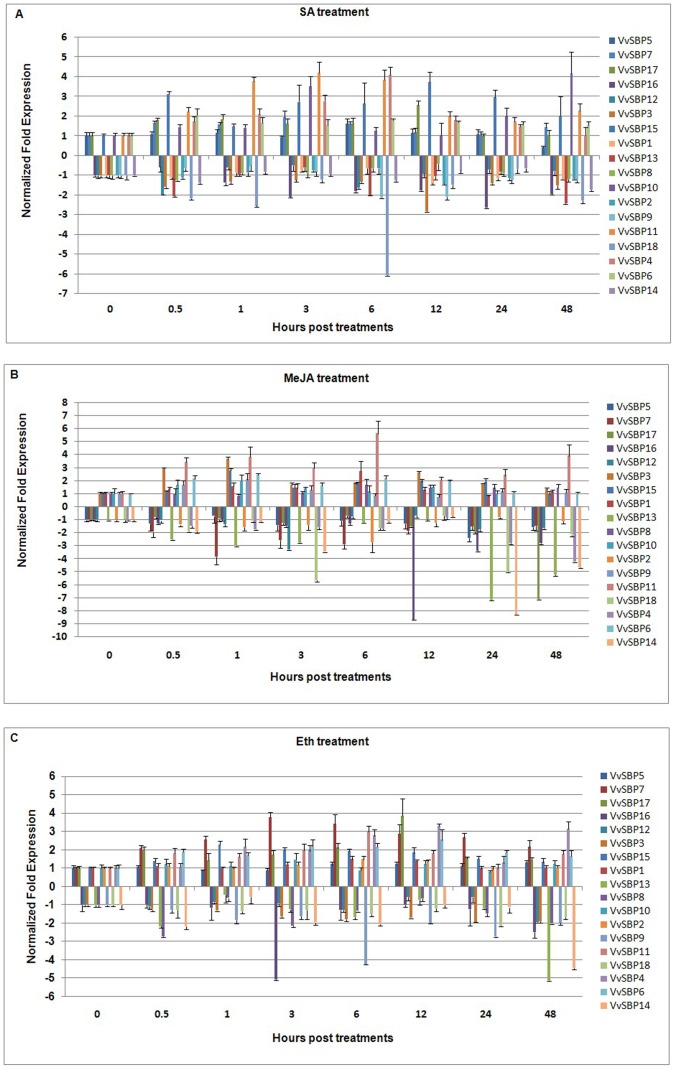
Figure 9. Expression levels of grape SBP-box genes following SA(A), MeJA(B), and ET (C) treatment in the leaves of V. quinquangularis ‘Shang-24’.
Grape Actin1 was used as an internal control for qRT-PCR and fold changes were used to indicate expression levels in treated leaves compared to negative controls, which were set to 1 or −1 depending on the expression trends. Mean values and SDs were obtained from three technical and three biological replicates.

