Figure 2.

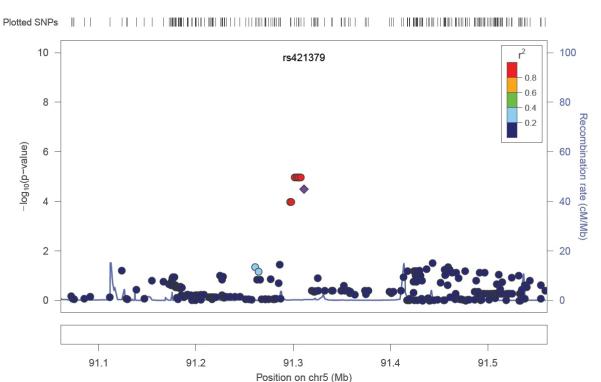
Regional plot of p-values arising from cox-proportional hazard models, 250 kb either side of the rs421379 variant in stage-1. P-values are from imputed and the genotyped SNPs.

Regional plot of p-values arising from cox-proportional hazard models, 250 kb either side of the rs421379 variant in stage-1. P-values are from imputed and the genotyped SNPs.