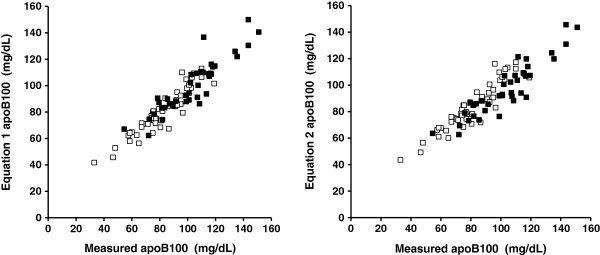
Figure 1.

Plots of untransformed values of measured apolipoprotein B100(apoB100; X axis) vs. estimated apoB100from equation 1(Y axis; left panel) and equation 2 (Y axis; right panel) in n =87 patients with type 2 diabetes mellitus. Equation 1: apoB100 (mg/dL) = [0.65 x non-high - density lipoprotein cholesterol (mg/dL)] + 6.3 (mg/dL). Equation 2: apoB100 (mg/dL) = − 33.12 (mg/dL) + [0.675 x low-density lipoprotein cholesterol (mg/dL)] + [11.95 x ln [triglycerides] (mg/dL)]. All values obtained from the means of different estimates performed on separate days. The open squares represent patients with mean fasting triglycerides (TG) <150 mg/dL; the solid squares represent patients with elevated fasting TG (150 - 400 mg/dL).
