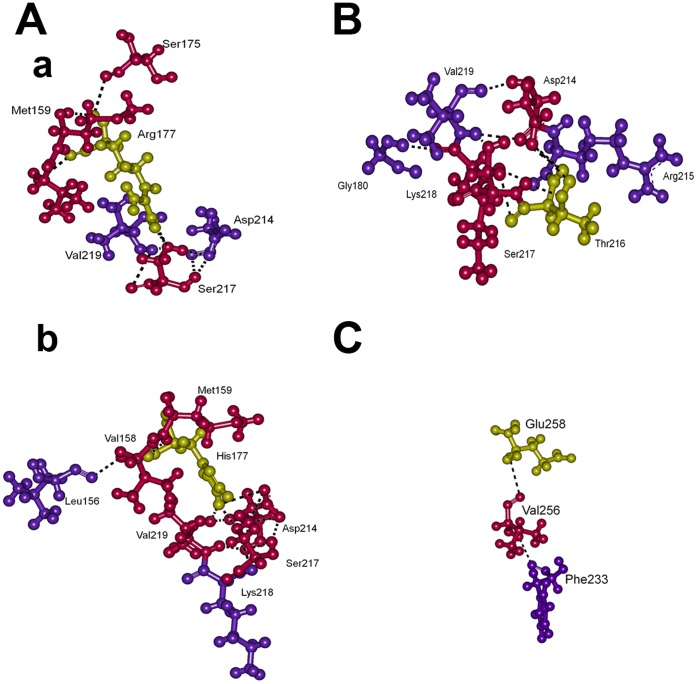
Figure 4. Intra-molecular interactions.
For the represented snapshots of MD simulations (Figure 3), two layers of neighbouring residues between corresponding WT and mutant residues along with their hydrogen bonds are displayed. Here, (A) a) WT and b) Arg177His at 10 ns, (B) Ala216Thr at 9 ns and (C) WT at 1 ns. At 9 ns Ala216 of WT and at 1 ns Lys258 of Glu258Lys did not make any interactions, hence they are not shown. WT and mutant residues 177, 216 and 258 are shown in yellow, and the residues directly interacting with these residues are shown in pink and are described as first layer. The residues that are interacting with first layer of residues are depicted as second layer and shown in violet.

