
Figure 6.
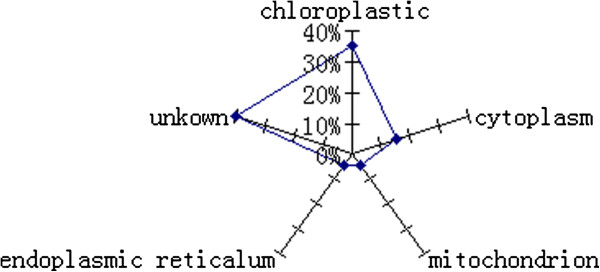
The subcellular location of identified proteins. Subcellular locations of the proteins were assigned according to the GO annotations and are expressed as percentages of the assigned proteins.
Official websites use .gov
A
.gov website belongs to an official
government organization in the United States.
Secure .gov websites use HTTPS
A lock (
) or https:// means you've safely
connected to the .gov website. Share sensitive
information only on official, secure websites.
The subcellular location of identified proteins. Subcellular locations of the proteins were assigned according to the GO annotations and are expressed as percentages of the assigned proteins.