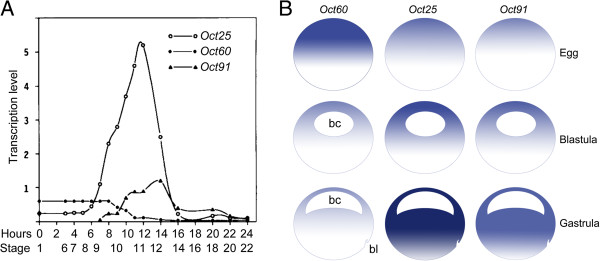
Figure 1.

Schematic illustration of spatiotemporal expression of Oct60, Oct25 and Oct91 during Xenopus embryogenesis. (A) Temporal expression of Oct60, Oct25 and Oct91 in different stages of development. Reproduced from [30] with minor modifications. (B) Spatial distribution of Oct60, Oct25 and Oct91 transcripts in fertilized egg, blastula and gastrula embryos. Heavier color represents higher level of transcription. bc: blastocoel; bl: dorsal blastopore lip.
