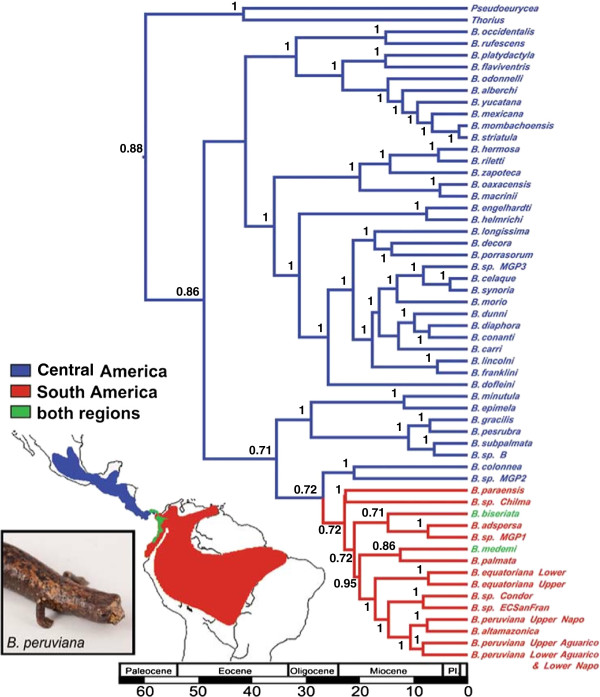
Figure 2.
Chronogram and ancestral area reconstruction for Central and South American Bolitoglossa based on Rag1 and Cytb. Mean divergence times are based on Bayesian species tree estimation (non-bolitoglossines are not shown). Biogeographic reconstruction was calculated in Lagrange. The highest split probability for the ancestral area subtends each node, and branches are colored accordingly: Central America (blue), South America (red), and both regions (green). These analyses show a single origin of South American Bolitoglossa by the Early Miocene, and two recent secondary re-colonizations of Central America by species that occur in both regions.

