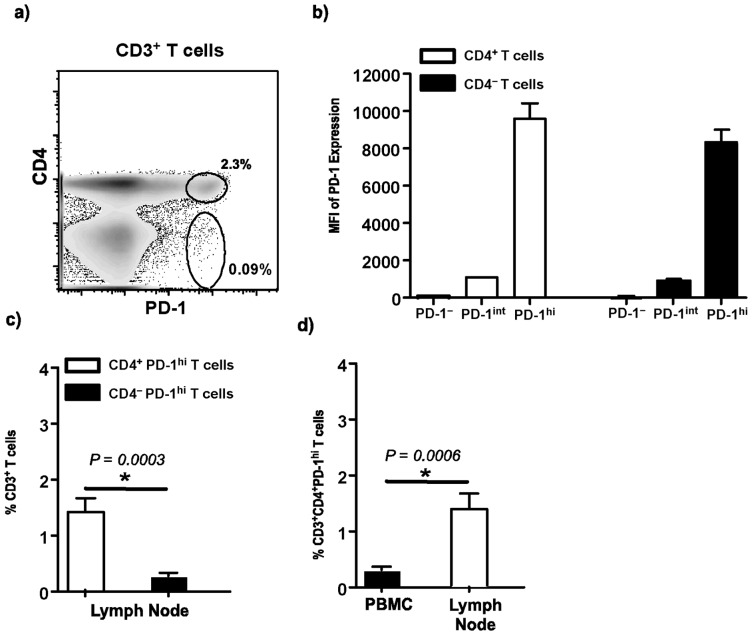
Figure 1. Lymph nodes are enriched for CD4+PD-1hi T cells.
(a) Representative dot plot b) Mean fluorescence intensity (MFI) of PD-1 expression on lymph node CD4+ and CD4– T cells subsets. c) Relative proportions of CD4+PD-1hi T cells and CD4– PD-1hi T cells in LN and d) relative proportions of CD3 gated CD4+PD-1hi T cells in LN and peripheral blood mononuclear cells (PBMC).

