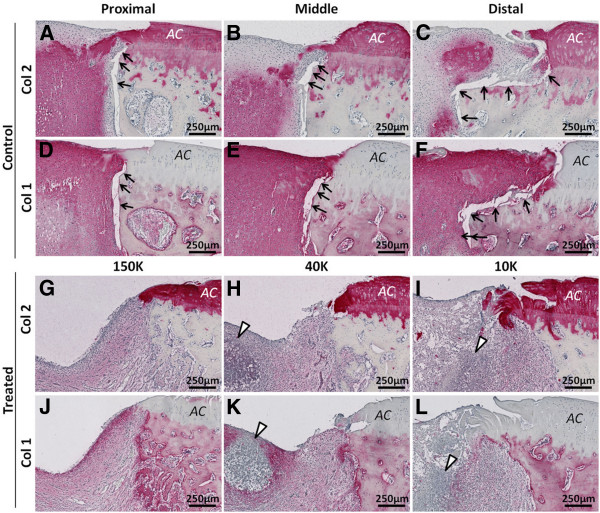
Figure 11.
Treated defects show better lateral repair tissue integration with the bone plate than control defects. Panels (A-C, G-I) show collagen type II-stained sections and Panels (D-F, J-L) show collagen type I-stained sagittal sections from control defects (A-F) and treated defects (G-L) 21 days post-treatment). Symbols: AC: Articular cartilage; Black arrows: Detached repair tissue; White arrowheads: neutrophil-rich granulation tissue.

