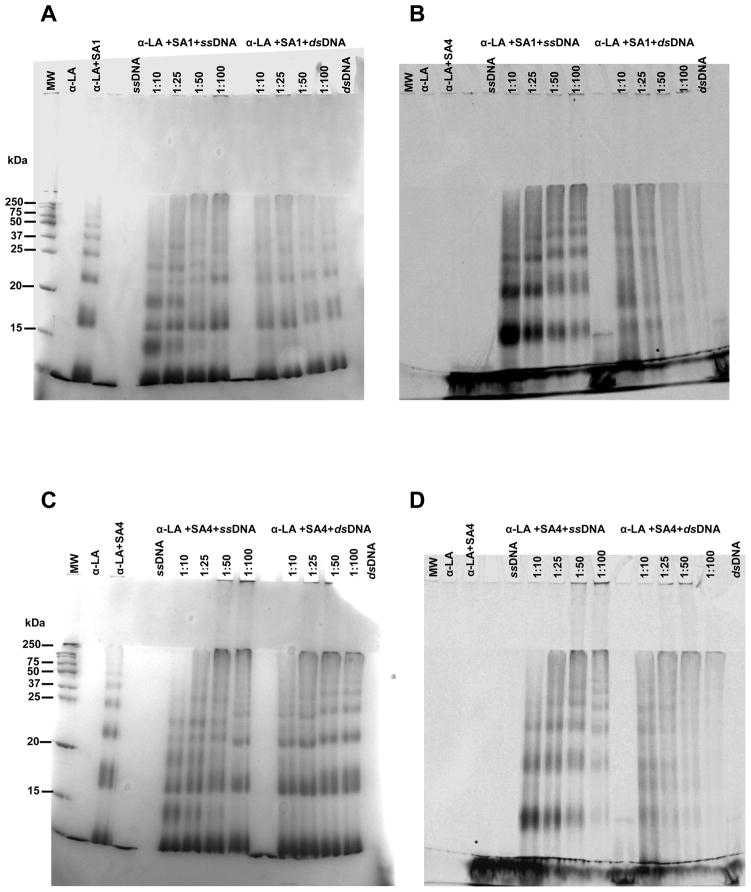
Fig 8.
SDS-PAGE of the reaction products obtained after incubation at 37 °C for 24 hours in 10 mM Tris, 50 mM KCl, pH 7.4 at 37 °C of α-LA (25 μM) with 250 μM of SA1 (PANELS A and B) or SA4 (PANEL C and D) in the presence of single stranded or double stranded DNA at the reported DNA:Pt molar ratio. PANELS A and C show the gels stained with Coomassie Brilliant blue whereas PANEL B and D report the signal of the fluorescein-labeled DNA. MW are the protein molecular weight, the untreated DNA as well as the proteins incubated in the presence/absence of TPA were used as controls.

