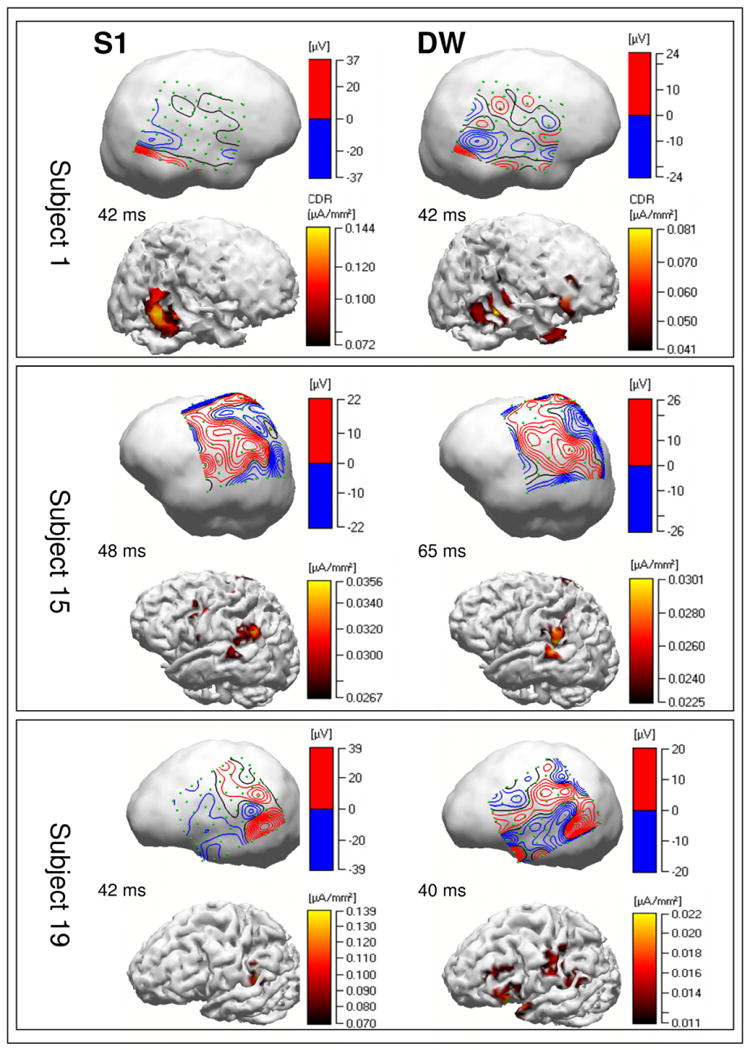
Figure 3.

Topographies of the cortical potentials and estimated current densities for three selected subjects (out of 20) showing differences in cortical potential distributions and generators of S1 signal P50 potential (stimulus registration) and S1-S2 difference waves (sensory gating). Differences are mostly shown in terms of individual regions that are involved in both (subject 15) or predominantly in one of two studied processes such as stimulus registration and repetition suppression (subjects 1 and 19). Data from 20 subjects are shown in the Suplementary Materials section. DW, difference wave; CDR, current density reconstruction.
