
Figure 5.
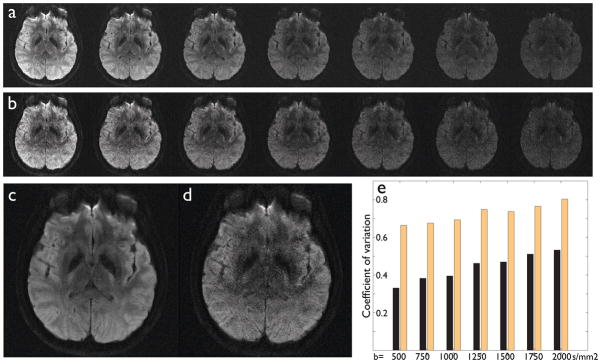
(a): MUSE-generated DWI corresponding to different b factors (from in a step). (b): SENSE-generated images of the corresponding b factors (from ). (c): The magnitude average of all 7 MUSE-generated DWI. (d): The magnitude average of all 7 SENSE-generated DWI. (e) The coefficient of variation measured from white-matter ROIs of MUSE-DWI (black bars) and SENSE-DWI (yellow bars) corresponding to different b factors.