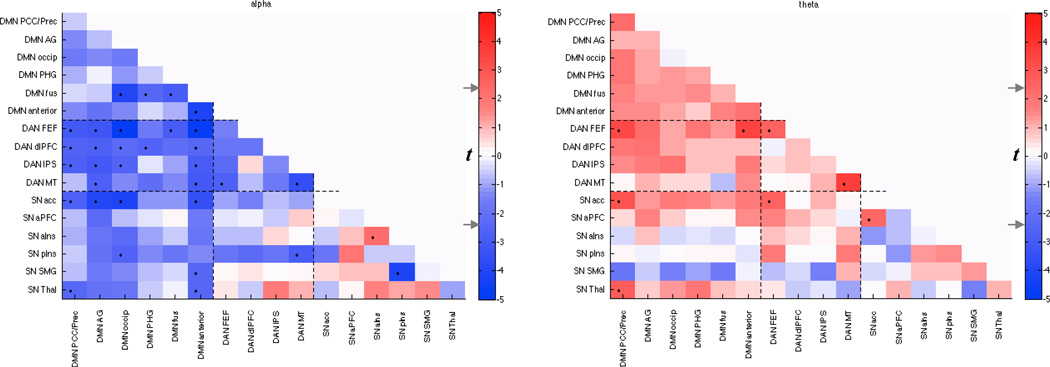
Figure 4.
Relationship between time-varying EEG power and functional connectivity within and between sub-networks (Table 2) of the DMN, DAN, and SN. Color represents the group-level t-score obtained by regressing sliding-window functional connectivity of sub-network pairs against sliding-window EEG alpha and theta power time series. Since this is an exploratory analysis intended to reveal the overall topographic pattern of the previously established effects, only uncorrected t-values are reported. The t-value corresponding to a 2-sided p=0.05 uncorrected (|t(8)|=2.3) is indicated on the colorbar (gray arrows), and suprathreshold entries are indicated in the matrix by ‘•’.

