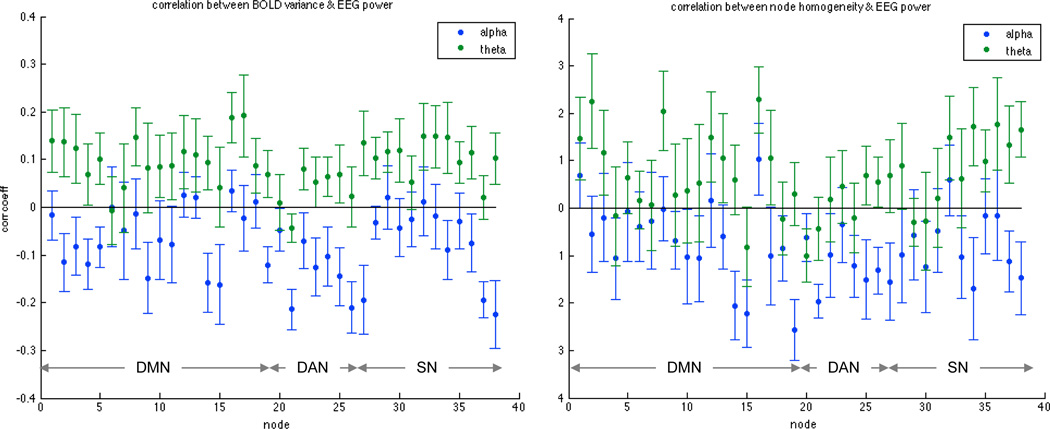
Figure 6.
Relationship between EEG power and time-varying changes in (left) BOLD signal variance and (right) within-node homogeneity. Plots show the mean (± standard error, N=10) of correlation coefficients across subjects, and data were obtained using a window size of 40 s. Ordering of nodes is consistent with Table 2.

